

<문제>
그림은 진동수가 0.75Hz이고 +x 방향으로 진행하는 파동의 변위를 위치 x에 따라 나타낸 것이다. 실선과 점선은 각각 시간 t=0, t=t0 일 때 파동의 모습이다. t=0에서 파동의 변위는 t=0 이후 t=t0일 때 처음으로 2m가 된다. 이에 대한 설명으로 옳은 것만을 <보기>에서 있는 대로 고른 것은?
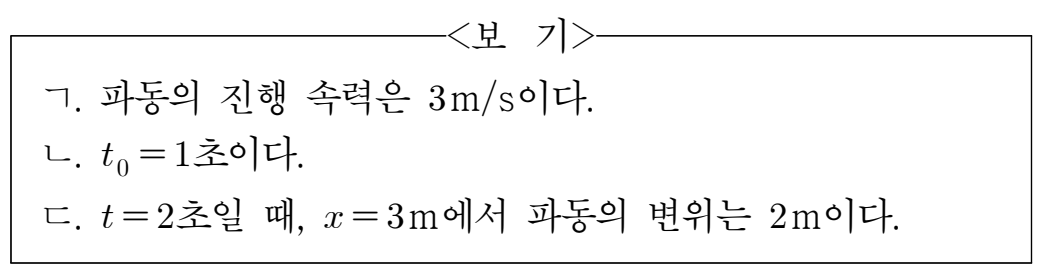
<선택지>
① ㄱ ② ㄷ ③ ㄱ,ㄴ ④ ㄴ,ㄷ ⑤ ㄱ,ㄴ,ㄷ
[풀이]
이 문제는 파동의 움직임을 상상할 수 있으면 생각보다 쉽게 해결할 수 있다. 그런데 파동의 움직임을 상상하는 것은 생각보다 어렵다. 연습이 필요한데, 연습에는 욕실의 오리 인형을 생각하면 도움이 된다.

욕조에 오리인형이 떠 있고 물결이 친다. 이 오리 인형은 마법의 오리 인형이라 물결에 따라 위아래로 움직이지만, 옆으로는 절대 미끌어지지 않는다고 한다. 이 오리 인형이 위아래로 움직이는 것을 기준으로 물결파의 주기를 정할 수 있다. 문제에서 진동수가 0.75Hz로 주어졌으니 오리 인형은 1초에 0.75번 오르락 내리락 할 것이다. 0.333초에 1/4번, 0.666초에 2/4번, 1초에 3/4번, 1.333초에 1번... 이렇다. 즉 오리 인형의 진동이 한 주기를 타는 데 걸리는 시간은 1.3333초가 된다.
이제 파동의 움직임을 상상해 보자.
위 흑백 그림을 보면 마치 파동이 왼쪽으로 이동한 것 같아 보이는데, 초록 색 그래프의 움직임과 각 순간 t값의 변화를 잘 보면 파동은 오른쪽으로 움직이고 있는 것이 분명하다. 이제 파동의 움직임이 눈에 익었다면 문제를 해결해 보자.
조건 (ㄱ)

아래 애니메이션에서 0.333초동안 1미터를 이동하는 것이 확인된다. 그럼 1초동안에는 3m를 가게 되니 진행 속도는 3m/s가 맞다.
다음 조건 (ㄴ)

이것도 맞다. 1초동안 파장의 3/4만큼이 우측으로 슬라이딩 한다. 파장은 4m 이므로 3m를 우측으로 미끌어지면 주황색 점선 그래프와 만난다.
마지막으로 조건 (ㄷ)

쉽게 생각해서 t=0 에서 1로 되는 동안 그래프가 왼쪽으로 1m 이동했으니 t=0에서 t=2로 된다면 그래프는 왼쪽으로 2m이동할 것이라고 생각해도 무방하다. 사실은 오늘쪽으로 3칸 가고 오른쪽으로 3칸 더 가는 건데. 그게 결국은 돌아 돌아 왼쪽으로 1칸 그리고 왼쪽으로 한칸 더 가게 되는 것과 같아진다. 파동은 반복하므로.
그래서 위 애니메이션에서 t=0.666일 때의 그래프를 눈 크게 뜨고 보면 x=3에서의 변위는 2이다. ㄷ은 맞다.
따라서 답은 5번이 된다.

[에필로그]
파동 문제는 주어진 조건을 이용해서 파동의 움직임을 머리속으로 애니메이션 할 수 있는 능력이 필요하다. 유형 별로 수식을 암기할 수도 있겠지만, 경우의 수가 너무 많아서 약간의 조건만 달라 져도 틀린 답을 내게 되고 흥미를 잃게 될 우려가 있다. 연습 말고는 다른 방법은 없는 것 같다.
[Python 코드]
# Wave shift animation with pause segments and optional GIF saving or live display.
# Smooth loop across one full period (T = 1/f). No duplicated first/last frame to prevent flicker.
# Pauses at t = 1/3 T and 2/3 T, then continuous to T, and loops back to 0 seamlessly.

import numpy as np
import matplotlib.pyplot as plt
from matplotlib.animation import FuncAnimation, PillowWriter

# ===== User options =====
OUTPUT_MODE = "gif"                 # "gif" or "show"
GIF_PATH = "wave_slide_to_right.gif"     # path to save GIF when OUTPUT_MODE == "gif"
FPS = 30                            # frames per second
PAUSE_FRAMES = 15                   # pause duration at t=1/3 T and t=2/3 T (frames)
END_REPEAT_DELAY_MS = 0             # used only for live display (show mode)

# ===== Wave parameters =====
A = 2.0               # amplitude [m]
f = 0.75              # frequency [Hz]
lam = 4.0             # wavelength [m]  (so in 1 s, shift = 0.75*λ to +x)
omega = 2*np.pi*f     # angular frequency
k = 2*np.pi/lam       # wave number
phi = 0.0             # initial phase at t=0
T = 1.0 / f           # period = 4/3 s

# Spatial axis (0~8 m like the figure)
x = np.linspace(0, 8, 1000)

# Reference curves for t=0 (solid light) and t=T (same shape as t=0)
y_t0 = A * np.sin(k*x - omega*0 + phi)
y_tT = A * np.sin(k*x - omega*1 + phi)

# ===== Build timeline with pauses at t=1/3 T and t=2/3 T =====
# Important for smooth loop: DO NOT include the final frame at t=T, and do not pause there.
segments = [(0.0, T/4.0), (T/4.0, 2.0*T/4.0), (2.0*T/4.0, 3.0*T/4.0), (3.0*T/4.0, 4.0*T/4.0)]
frames_per_segment = int(FPS * (T/3.0))  # equal frames per segment across one period

t_values = []
for (t_start, t_end) in segments:
    # frames inside the segment, excluding endpoint to avoid duplicate at boundaries
    seg_ts = np.linspace(t_start, t_end, frames_per_segment, endpoint=False)
    t_values.extend(seg_ts.tolist())
    # add a pause at internal breakpoints only (not at the very end t=T)
    if t_end <= T:  # internal boundary
        t_values.extend([t_end] * PAUSE_FRAMES)

# ===== Set up the figure =====
fig, ax = plt.subplots(figsize=(7, 3.2), dpi=150)
ax.set_xlim(0, 8)
ax.set_ylim(-2.4, 2.4)
ax.set_xlabel("x (m)")
ax.set_ylabel("Amplitude (m)")

# Static references
ax.plot(x, y_t0, linewidth=1.0, alpha=0.4, label="t=0")
ax.plot(x, y_tT, linestyle="--", linewidth=1.0, alpha=0.8, label="t=1")

# Animated line
line, = ax.plot(x, y_t0, linewidth=2.0, label="Sliding Wave")
# show time modulo T to make the loop feel natural
title = ax.set_title("Sliding Wave: t = 0.000 s")
ax.legend(loc="upper right")


def update(frame_index):
    t = t_values[frame_index]
    y = A * np.sin(k*x - omega*t + phi)
    line.set_data(x, y)
    t_mod = (t % T)
    title.set_text(f"Sliding Wave: t = {t_mod:0.3f} s")
    return line, title

ani = FuncAnimation(
    fig,
    update,
    frames=len(t_values),
    interval=1000/FPS,
    blit=False,
    repeat=True,
    repeat_delay=END_REPEAT_DELAY_MS  # used for live display only
)

# ===== Output selection =====
if OUTPUT_MODE.lower() == "gif":
    # Save GIF via PillowWriter (GIF will loop; we avoided duplicate end/start frames)
    writer = PillowWriter(fps=FPS)
    ani.save(GIF_PATH, writer=writer)
    print(f"Saved: {GIF_PATH}")
elif OUTPUT_MODE.lower() == "show":
    plt.show()
else:
raise ValueError("Unknown OUTPUT_MODE. Use 'gif' or 'show'.")[출처: 2026년 6월 모평/모의고사 고3 물리1 10번]
'물리 > 파동' 카테고리의 다른 글
| 매질 경계에서 사인파의 진행 모습 (5) | 2025.08.13 |
|---|